Quantcast
Channel: Publications – GeoLog
Viewing all 89 articles
Browse latest View live

Roundup of EGU Twitter Journal Club 1

$
0
0

The EGU’s Twitter Journal Club had its first virtual meeting yesterday, discussing an article on a climate change related blunder made by The Times Comprehensive Atlas of the World and the swift response of an international group of scientists.

You can read a full transcript of our discussion on our brand new Storify page. Even though Twitter went down after an hour’s discussion, we’re optimistic that the TJC will continue to bring out the best of our now-over-1,000 followers!

Greenland ice outlines, from Kargel et al. 2012, published in The Cryosphere, an open-access journal of the European Geosciences Union (6, 533–537, 2012)

The European Geosciences Union, through publishing house Copernicus Publications, publishes 14 peer-reviewed Open Access journalsThe Cryosphere (TC) (IF 3.641)  is an international scientific journal dedicated to the publication and discussion of research articles, short communications and review papers on all aspects of frozen water and ground on Earth and on other planetary bodies.


EGU Twitter Journal Club: Article 2

$
0
0

Time for the second edition of the EGU’s Twitter Journal Club, our interactive online discussion about a timely scientific article. Full details can be found here

This time, our article focuses on one of the most extreme environments on Earth, the Atacama Desert in Chile, and the method by which rock-dwelling microorganisms obtain their water. The Twitter discussion will take place on Thursday 12 July at 17:00 CEST (hashtag #egutjc2). Please email the EGU’s Science Communications Fellow Edvard Glücksman with further questions. Happy reading!

The Atacama Desert is one of Earth’s driest environments. (credit: Wikimedia)

Novel water source for endolithic life in the hyperarid core of the Atacama Desert
Biogeosciences, 9, 2275-2286, 2012

Abstract. The hyperarid core of the Atacama Desert, Chile, is possibly the driest and most life-limited place on Earth, yet endolithic microorganisms thrive inside halite pinnacles that are part of ancient salt flats. The existence of this microbial community in an environment that excludes any other life forms suggests biological adaptation to high salinity and desiccation stress, and indicates an alternative source of water for life other than rainfall, fog or dew. Here, we show that halite endoliths obtain liquid water through spontaneous capillary condensation at relative humidity (RH) much lower than the deliquescence RH of NaCl. We describe how this condensation could occur inside nano-pores smaller than 100 nm, in a newly characterized halite phase that is intimately associated with the endolithic aggregates. This nano-porous phase helps retain liquid water for long periods of time by preventing its evaporation even in conditions of utmost dryness. Our results explain how life has colonized and adapted to one of the most extreme environments on our planet, expanding the water activity envelope for life on Earth, and broadening the spectrum of possible habitats for life beyond our planet.

Questions to think about:
1. How would you summarise this article in a tweet?

2. The Atacama Desert is one of the driest environments on the planet. Can you think of others, and do you know of similar studies done there?

3. What is the link between the research presented here and our quest to find extraterrestrial life?

4. How could the methods presented here be improved in follow-up studies?

5. Do you see industrial applications for these findings?

Related media coverage
National Geographic Magazine
Sydney Morning Herald

The European Geosciences Union, through publishing house Copernicus Publications, publishes 14 peer-reviewed Open Access journalsBiogeosciences (BG, IF 3.587)  is an international scientific journal dedicated to the publication and discussion of research articles, short communications and review papers on all aspects of the interactions between the biological, chemical and physical processes in terrestrial or extraterrestrial life with the geosphere, hydrosphere and atmosphere. The objective of the journal is to cut across the boundaries of established sciences and achieve an interdisciplinary view of these interactions.

Roundup of EGU Twitter Journal Club 2

$
0
0

The EGU’s Twitter Journal Club had its second virtual meeting yesterday, this time focusing on a paper from the EGU’s journal Biogeosciences, investigating the means by which microscopic life is sustained in the hostile aridity of the Atacama Desert. Read a full transcript of our discussion on our Storify page!

Vast expanse of Chile’s Atacama Desert, one of the most arid regions in the world. (source: Wikimedia)

The European Geosciences Union, through publishing house Copernicus Publications, publishes 14 peer-reviewed Open Access journalsBiogeosciences (BG, IF 3.587)  is an international scientific journal dedicated to the publication and discussion of research articles, short communications and review papers on all aspects of the interactions between the biological, chemical and physical processes in terrestrial or extraterrestrial life with the geosphere, hydrosphere and atmosphere. The objective of the journal is to cut across the boundaries of established sciences and achieve an interdisciplinary view of these interactions.

EGU Twitter Journal Club: Article 3 – Tree-height data and carbon storage

$
0
0

It’s time for the third edition of the EGU’s Twitter Journal Club, our interactive online discussion about a timely scientific article. If you have not yet taken part in one of these discussions, read more about it in our introductory post and make sure to participate on this third edition! 

This time, we will be discussing an article recently published in the EGU’s Open Access journal Biogeosciences that features an innovative way of calculating the amount of carbon stored in tropical forests which incorporates tree-height data. The discussion will take place on Twitter next Thursday 27 September at 17:00 CEST, and you can take part by following the EGU’s Twitter account (@EuroGeosciences) and using the hashtag #egutjc3 on your tweets. Please email the EGU’s Science Communications Fellow Edvard Glücksman if you have any further questions.

Happy reading – and don’t be scared of the equations, they won’t bite!

Incorporating tree-height data into calculations of the amount of carbon stored in tropical forests reduces the estimates by roughly 13%. (Source: Imaggeo.net, credit: Alina Mihaela Luchian)


Tree height integrated into pantropical forest biomass estimates
Biogeosciences, 9, 3381–3403, 2012

Abstract. Aboveground tropical tree biomass and carbon storage estimates commonly ignore tree height (H). We estimate the effect of incorporating H on tropics-wide forest biomass estimates in 327 plots across four continents using 42 656 H and diameter measurements and harvested trees from 20 sites to answer the following questions:

1. What is the best H-model form and geographic unit to include in biomass models to minimise site-level uncertainty in estimates of destructive biomass?

2. To what extent does including H estimates derived in (1) reduce uncertainty in biomass estimates across all 327 plots?

3. What effect does accounting for H have on plot- and continental-scale forest biomass estimates?

The mean relative error in biomass estimates of destructively harvested trees when including H (mean 0.06), was half that when excluding H (mean 0.13). Power- and Weibull-H models provided the greatest reduction in uncertainty, with regional Weibull-H models preferred because they reduce uncertainty in smaller-diameter classes (< or = to 40 cm D) that store about one-third of biomass per hectare in most forests. Propagating the relationships from destructively harvested tree biomass to each of the 327 plots from across the tropics shows that including H reduces errors from 41.8 Mg/ha (range 6.6 to 112.4) to 8.0 Mg/ha (−2.5 to 23.0). For all plots, aboveground live biomass was −52.2 Mg/ha (−82.0 to −20.3 bootstrapped 95% CI), or 13%, lower when including H estimates, with the greatest relative reductions in estimated biomass in forests of the Brazilian Shield, east Africa, and Australia, and relatively little change in the Guiana Shield, central Africa and southeast Asia. Appreciably different stand structure was observed among regions across the tropical continents, with some storing significantly more biomass in small diameter stems, which affects selection of the best height models to reduce uncertainty and biomass reductions due to H. After accounting for variation in H, total biomass per hectare is greatest in Australia, the Guiana Shield, Asia, central and east Africa, and lowest in east-central Amazonia, W. Africa, W. Amazonia, and the Brazilian Shield (descending order). Thus, if tropical forests span 1668 million km2 and store 285 Pg C (estimate including H), then applying our regional relationships implies that carbon storage is overestimated by 35 PgC (31–39 bootstrapped 95% CI) if H is ignored, assuming that the sampled plots are an unbiased statistical representation of all tropical forest in terms of biomass and height factors. Our results show that tree H is an important allometric factor that needs to be included in future forest biomass estimates to reduce error in estimates of tropical carbon stocks and emissions due to deforestation.

Questions to think about:

1. How would you summarise this article in a tweet?

2. What are the broader implications of this study? (hint: see recent Nature blurb linked to below)

3. What methods could be used to improve data within biomass maps?

4. What are the practical implications of this and similar studies on how we interpret carbon storage within biomass?

5. Could this article be improved – specifically, are there too many equations?

Related media coverage:
Nature

The European Geosciences Union, through publishing house Copernicus Publications, publishes 14 peer-reviewed Open Access journals. Biogeosciences (BG, IF 3.859) is an international scientific journal dedicated to the publication and discussion of research articles, short communications and review papers on all aspects of the interactions between the biological, chemical and physical processes in terrestrial or extraterrestrial life with the geosphere, hydrosphere and atmosphere. The objective of the journal is to cut across the boundaries of established sciences and achieve an interdisciplinary view of these interactions.

Roundup of EGU Twitter Journal Club 4

$
0
0

The EGU’s Twitter Journal Club had its fourth virtual meeting yesterday, this time focusing on a paper from the journal Atmospheric Environment. The work examines methods of assessing contributions of individual emissions to ozone and hence to climate change. Read a full transcript of the discussion on our Storify page!

Emissions of nitrogen oxides (NOx) lead to formation of ozone, which is an important greenhouse gas. (Photo: Edvard Glücksman)


Become a book reviewer for the EGU newsletter!

$
0
0

Interested in free books and getting published? The European Geosciences Union has an opportunity for you…

The Union’s newsletter, GeoQ, is a magazine distributed for free to all Union members – that’s around 12,000 scientists – and we’re looking for reviewers wiling to write short book reviews for it!

Whether you are a young scientists or an established researcher in the Earth, planetary and space sciences, we would love to hear from you.  Reviewers will receive the books free of charge and their work will be published in the newsletter, accompanied by their name and a short biography. It’s an ideal opportunity for scientists with a flair for science writing interested in seeing their texts published in a newsletter with a wide readership – and, of course, there are the free books!

GeoQ, the EGU’s newsletter

Contact GeoQ’s Chief Editor, Bárbara Ferreira, at media@egu.eu if you are interested in reviewing books for the newsletter, or if you have any questions about this opportunity. Please also inform Bárbara about your areas of expertise – you can check the list of EGU Divisions for reference.

Events for Young Scientists at EGU 2013

$
0
0

Short Courses

Open Access (OA)

Demystifying Open Access – an open discussion for early career researchers tackling how OA can benefit young scientists without compromising their careers. From what it costs to publish an open access paper to how we can measure its impact, all interested scientists are invited to drop in and join us over drinks in a marketplace of discussion.

How to apply for a job. It’s a topic rarely addressed in postgraduate courses, but in this session, career training experts will help you make the most of your strengths and show them off to a potential employer. Pick up some tips about finding the right job for you, preparing a good CV, and writing a targeted cover letter.

The Blogs and social media in scientific research session explores the ways in which scientists can use blogs and social media to communicate their work. Why should scientists blog or use Twitter?  How do they find the time? And what are the benefits? A panel of blog and social media-savvy scientists will talk about their experience before opening the discussion to the audience.

Last year’s communicate your science workshop

If you’re a Geomorphologist, you’ll be set for the week as the Geomorphology division has loads on offer! Pickup skills on dating techniquesproject supervisionopen access publishing  and you can also meet the master for tips from seasoned academics.

If you’re a Hydrologist, there’s also the opportunity to meet experts in the field in a round-table discussion with established scientists. You can also pick up pointers on writing the perfect hydrology paper.

See the session programme for more short courses at EGU 2013.

Meeting other Geoscientists during the tweet up at last year’s General Assembly.

Networking

The opening reception on Sunday, 7 April is a great opportunity to meet people, network, get to know the Assembly venue. There is free food and drink as well as specific places for Young Scientists to meet up on the Green Level. Tall signs will tell you where to go, so stop by to meet fellow early career researchers, division presidents and the Young Scientist representatives for the EGU (Jennifer Holden and Sara Mynott).

Earlier in the day, there will also be an opportunity for women in the geosciences to attend a networking event run by the Earth Science Women’s Network, for more information and how to register, see here.

Check this post for more details on networking opportunities at the General Assembly.

Have your say!

What would you like us to do for you? Join us over lunch (food provided!) to find out what the EGU can do to for Young Scientists and let us know what you’d like more of. These will take place on Tuesday 9 April and Thursday 11 April.

Other Sessions

The Medal Lectures, which highlight the work of brilliant scientists. Head on over to the lectures on the Arne Richter Award for Outstanding Young Scientists (ML4-ML7) and be inspired!

You can also join in a conference call for Young Researchers in Earth Sciences, which aims to promote interdisciplinary research efforts among early career researchers.

Introducing ESurf

$
0
0

ESurf, more formally known as Earth Surface Dynamics is the new open access journal from the EGU. Focussing on the processes that affect the Earth’s surface at all scales, ESurf aims to communicate the interactions of Earth surface processes with the lithosphere, biosphere, atmosphere, hydrosphere and pedosphere. Highlighting field measurements, remote sensing and experimental and numerical modeling of Earth surface processes.

The first issue of Earth Surface Dynamics!

As with most other EGU journals, Earth Surface Dynamics has an open review process, where the submitted papers are also available in an open access discussion forum (Earth Surface Dynamics Discussions). What’s more, because ESurf is the ‘new kid on the block’, all submission charges are currently waived, so it’s free to submit, free to access and free to use. Brilliant!

Take a look at the first issue here and to keep updated on the latest research in Earth Surface Dynamics, follow the journal on Twitter (@EGU_ESurf).

More information about the launch of this great open access journal is also available on the EGU website.


Read all about it! The latest on EGU journals

$
0
0

The last month has been a big one for the EGU’s publications, with a new journal in the pipeline, another adopting interactive peer review and a new addition to Web of Science. Here’s the latest…

Soil

Say hello to SOIL

We will be launching a new interactive, open access journal at the EGU 2014 General Assembly. SOIL is dedicated to the publication and discussion of high-quality research in the field of soil system sciences. It will open for submissions in May 2014, following the journal’s official launch at EGU 2014.

Find out more about SOIL on the EGU website and take sneak peek at SOIL over at www.soil-journal.net.


NPG_cover


Nonlinear Processes in Geophysics becomes interactive
Nonlinear Processes in Geophysics (NPG), is transitioning from an open access journal with a traditional review process into an interactive open access journal that uses public peer-review and interactive public discussion. Find out more about this new peer review process here.


ESD cover

Earth System Dynamics indexed in ISI Web of Science

Last but not least, one of our open access journals, Earth System Dynamics (ESD), is to be included in the Web of Science/ISI listings, following the com­pletion of their assessment of the quality, characteristics, and flow of papers published in the journal since its launch in 2010! This is terrific news and highlights the tremendous work of the editorial board and the scientific community in submitting so many excellent articles to ESD. Over the next few months all ESD papers will be added to the listings.

Stay up-to-date with EGU news at www.egu.eu/news/announcements.

GeoEd: Under review

$
0
0

In this month’s GeoEd column, Sam Illingworth tells us about how teaching undergraduate students about peer review can help eliminate bad practice.

To anybody other than a researcher, the words peer review might seem like a fancy new age management technique, but to scientists it is either the last bastion of defence against the dark arts or an unnecessary evil that purports to ruin our greatest and most significant works.

According to Wikipedia (itself a fine proponent), peer review is defined as “the evaluation of work by one or more people of similar competence to the producers of the work (peers). It constitutes a form of self-regulation by qualified members of a profession within the relevant field.”

Peer review itself is not a new concept; the first documented description of a peer-review process, being found in the ‘Ethics of the Physician’ by Ishap bin Ali Al Rahwi (854–931), states that the notes of physicians were examined by their contemporaries to assess if treatment had been performed according to the expected standards (you can read more on the history of the peer-review process in this article).

Even the great Carl Sagan found the critique of his work difficult to stomach (Photo credit: NASA JPL, via Wikimedia Commons).

Even the great Carl Sagan found the critique of his work difficult to stomach (Photo credit: NASA JPL, via Wikimedia Commons).

“Why do we put up with it? Do we like to be criticized? No, no scientist enjoys it.” So sayeth American cosmologist and author Carl Sagan about the ‘joys’ of peer review, in his book ‘The Demon-Haunted World: Science as a Candle in the Dark.’ He goes on to say that “Every scientist feels a proprietary affection for his or her ideas and findings. Even so… the hard but just rule is that if the ideas don’t work, you must throw them away.”

Just reading these words brings me out in the kind of cold sweat that I normally associate with seeing the bill from mechanic, after having your car serviced. You know that you are going to have to bite the bullet, but in your heart of hearts you just wish that it weren’t so.

Love it or loathe it the peer-review system is an integral part of being a researcher, and given its prevalence it is strange that for many scientists the whole notion of it is a completely alien concept until they first encounter the publication process during their postgraduate studies.

During the first year of my PhD I remember being aghast at the notion that two, or possibly three, strangers would be wholly responsible for deciding whether or not my research was deemed ‘suitable’ for publication, and despite my otherwise excellent undergraduate education I had nothing to prepare me for the whole ordeal. Thankfully I had a very experienced supervisor who was able to guide me through the whole process and teach me a few tricks of the trade (always respond politely, compliment the reviewer for their suggestions, avoid the urge to break down into tears and instead break the comments down into manageable chunks), but even now I still feel a sense of dread when an email notification appears in my inbox telling me that “the reviewer’s comments have been posted.”

Is this how reviewers are perceived? (Photo credit: deviantArt)

Is this how reviewers are perceived? (Photo credit: deviantArt)

By nature I am quite a defensive person, and have been known to take criticism (fair or otherwise) rather to heart, but my experiences of the peer review system have certainly helped me take a more level–headed and professional approach to the critique of my work. Crucially it has also helped me to become a better reviewer myself.

Constructive criticism is essential in order to help one develop as a researcher, and indeed as an individual, but some of the peer reviews that I have seen (and sadly been subjected to) are nothing more than mean-spirited attempts by the reviewer to assert their own supposed authority on a subject. This kind of analysis is beneficial to absolutely no one, and it should be the responsibility of the editors and administrative staff of the journals and e-zines to help eradicate it. There is always something positive to be said about any piece of research (unless it is utterly nonsensical, in which case again the editor should have stopped it from ever being submitted to a reviewer), and being totally negative in your comments will only serve as fuel for a vicious cycle in which young researchers believe that the purpose of peer review is to find fault in the work of others. Instead, good peer review should be a helpful critique of a fellow colleagues work, which politely points out any shortcomings, makes suggestions for improvements, and praises what is good.

I will now be teaching my own university students about the peer-review system, and will be asking them to mark one another’s work throughout the unit that I teach on Science Communication at Manchester Metropolitan University. I think that most undergraduate courses would benefit from a similar approach, not only to prepare future scientists, but also to help students learn how to respond to criticism and how to critique the work of others in a productive and conducive manner. By educating and encouraging young scientists in this way we can hope to potentially avoid these kinds of reactions in the future.

Teaching about peer review at university can help to eliminate bad practice (Photo credit: Gideon Burton).

Teaching about peer review at university can help to eliminate bad practice (Photo credit: Gideon Burton).

For those of you who are currently reviewing a paper, I set you the challenge of explicitly writing at least one compliment to the author. This could be in regards to the excellence or originality of their research, the structure or fluidity of the article, or indeed the clarity with which they express their ideas. To those of you who are not reviewing a paper, try and find at least one positive thing to say (the colour really brings out your eyes, it’s certainly an affordable mode of transport, these scones are delicious!) the next time that your opinion is required; I guarantee that it will leave everyone feeling just a little bit more capable of themselves and what they can achieve.

 By Sam Illingworth, Lecturer, Manchester Metropolitan University

Open Access: Access to knowledge

$
0
0

“Access to knowledge is a basic human right.” Yet sadly as scientists we are often forced to operate in a framework in which this is not always the case. This week sees the celebration of the eighth Open Access Week, and whilst there have undoubtedly been many achievements by the Open Access (OA) movement since 2009, there is still a long way to go before mankind’s basic human right to knowledge is restored.

Open for business: The Open Access logo (Photo credit: Wikimedia)

Open for business: The Open Access logo (Photo credit: Wikimedia)

So why all the big fuss about OA in the first instance? If you are reading this as a layperson or as a scientist at the outset of their scientific career, then you may be surprised to find out that it costs (often large sums of) money to read online research articles. Even if these fees are not being charged to you personally, the chances are that it is costing your research institution or library thousands of pounds/euros/dollars that could otherwise be spent on research, resources, jobs, or infrastructure (as an example, in 2009, Clemson University in the US, an institute with less than 17,000 students, spent an astonishing $1.3 million on journal subscriptions to the publishing magnate Elsevier alone).

Over the past 30 years, journal prices have out priced inflation by over 250%; but it wasn’t always like this. In the past journals existed for two reasons: as an affordable option for scientists to publish their work in (as opposed to the more expensive option of personally-published books), and as a place where members of the general public and the wider scientific community could find out about the advances in science that their taxes were helping to fund. Sadly, in recent times many journals seem to have lost their way on both counts, hence the need to open it up again.

Climbing Higher: The cost of journal articles continues to rise completely out of proportion to inflation (Photo credit: Association of Research libraries)

Climbing Higher: The cost of journal articles continues to rise completely out of proportion to inflation (Photo credit: Jorge Cham/PHD Comics)

The beginning of the modern OA movement can be traced back to the 4th July 1971, when Michael Hart launched Project Gutenberg, a volunteer effort to digitize and archive cultural works for free. However, it wasn’t until 1989 (and with the advent of the Internet) that the first digital-only, free journals were launched, amongst them Psycoloquy by Stevan Harnad and The Public-Access Computer Systems Review by Charles W. Bailey Jr.

Since then, the OA movement has grown considerably, although it is important to note that publishing articles so that they are free for all is itself not without expense. Despite the lack of print and mailing costs, there are still large infrastructure and staffing overheads that need to be taken into consideration, and so rather than make the reader pay, alternatives have to be found.

One alternative, known as the Gold route to OA, is to make the author(s) of the article pay for the right to have their research accessible by all. Many journals already require an Article Processing Charge (APC) to be paid before publication, and so some journals have simply elected to add an additional charge if the author wants to make their journal open to the general public.

The other main alternative is the Green route to OA, which involves the author placing their journal in a central repository, which is then made available to all. The journal in which the article was originally published will usually enforce an embargo period of a number of months or years that must pass before the published articles can be placed in these repositories, although this can often be circumnavigated by uploading final, ‘accepted for publication’, drafts of the article. You can read more about OA subject repositories in this article.

A sea of golden green: the availability of gold and green OA journal articles by scientific discipline in 2009 (Source: Björk, et al.).

A sea of golden green: the availability of gold and green OA journal articles by scientific discipline in 2009 (Source: Björk, et al.).

Both of these approaches to OA have their respective advantages and disadvantages, and normally research intuitions and/or funding bodies guide the route that researchers choose. The Research Councils UK (RCUK), for example, has a policy (which can be found here) that supports both the Gold and the Green routes to OA, though it has a preference for immediate access with the maximum opportunity for reuse. It is worth noting at this point that another key aim of the OA movement is that published research is free to reuse in future studies. This might seem like a fairly trivial point, but currently for any articles published in closed access journals, express permission is needed from the publishers if the results are to be used in any future studies.

Capture4

Top of the food chain: the top 10 UK universities in terms of APC funding distribution (Source: RCUK).

The major barrier that still needs to be overcome with regards to OA is determining who pays for the right to free access. At the moment many governments have a centralised pot, which they allocate to their different research institutes. However, issues arise when one considers the limitations that this imposes on poorer countries, institutes, research disciplines, and independent researchers. There is also the minefield of determining who gets how much and why; my own institute, Manchester Metropolitan University (MMU) has only been allocated enough funds to pay for 7 academic papers a year via the Gold route to OA. When you consider that some researchers would hope to publish that many papers themselves on a yearly basis, there is clearly a disconnect. It is for these reasons that many are pushing for ‘OA 2.0’, an initiative in which articles are, in the words of EGU’s former executive secretary Arne Richter, “Free to Read, Free to Download and Free to Publish.” However, such an approach will require a major change in the modus operandi of almost all publishing companies. It is worth noting that Copernicus, who are responsible for publishing the majority of EGU’s affiliated journals are very strong proponents of the Open Access movement, and have been one of the leading lights in an otherwise murky world.

The sad truth of the matter is that many of the more traditional journals are now run as big-business, moneymaking machines, safe in the knowledge that they can get away with charging large fees, because scientists are still desperate to publish in places with a ‘high-impact’. However, if enough scientists rise up and move away from these restrictive journals, and migrate towards those with an OA policy, then the impact factors will soon follow suit (in fact, there is already strong evidence that publishing in an OA journal will result in more citations for your research). Only then can we begin to reinstate knowledge as a basic human right available to all, rather than as an expensive luxury dolled out to the privileged few who can afford it.


By Sam Illingworth, Lecturer, Manchester Metropolitan University


All you ever wanted to know about EGU publications

$
0
0

Did you know that, the EGU, through Copernicus Publications, publishes 17 peer-reviewed open-access journals? The journals cover a range of topics within the Earth, planetary and space sciences: with publications spanning the cryospheric sciences, soil system sciences, through to non-linear processes in geophysics, there is something for everyone. Whatever your area of research, chances are you’ll be represented within the range of EGU publications!

Better still, the EGU is a signatory of the Berlin Declaration. This means we believe that scientific literature should be publicly available and free of charge. Anyone wishing to read, download, copy, distribute, search or print research findings is able to do so without encountering any financial, legal or technical barriers. Authors of research articles are fully protected, too! They retain full copyright for their work via the Creative Commons Attribution License, which requires that full credit for any distribution of the research is given and any changes made to figures and or/data is highlighted, too.

Most EGU Publications also extend the traditional peer-review process by applying the Interactive Public Peer Review system. This means that a manuscript is subjected to two stages of review. The figure below helps to illustrate the process.

Two-stage public peer review as practised in the scientific journal Climate of the Past (CP) and its discussion forum Climate of the Past Discussions (CPD). 1. Submission; 2. Access review; 3. Technical corrections; 4. Publication as Discussion paper; 5. Comments; 6. Final response; 7.Post-discussion editor decision; 8. Revisions; 9. Peer-review completion; 10. Final revised publication.

Two-stage public peer review as practised in the scientific journal Climate of the Past (CP) and its discussion forum Climate of the Past Discussions (CPD). 1. Submission; 2. Access review; 3. Technical corrections; 4. Publication as Discussion paper; 5. Comments; 6. Final response; 7.Post-discussion editor decision; 8. Revisions; 9. Peer-review completion; 10. Final revised publication.

In the first stage, the manuscript undergoes a rapid pre-screening and is immediately published as a ‘discussion paper’, in the journal discussion forum. During the next eight weeks or so, the paper is reviewed by the referees, as well as the scientific community. Referees and other scientists can leave comments which are published alongside the paper. The referee’s comments can be anonymous, or signed, whilst the public comments are always signed. Authors can actively participate in the discussion by clarifying remarks and offering further details to those reading the discussion paper.

The second stage of review follows: if the editor is satisfied with the author’s responses to the comments, the manuscript can be accepted for publication. If the editor still has some concerns about the publication, further revisions will be carried out until a final decision is reached. If necessary, the editor may also consult referees in the same way as during the completion of a traditional peer-review process. In order to increase transparency, some journals also publish a report that documents all changes to the paper since the end of the public discussion.

The system offers advantages to the authors, referees, editors and even the reader. The publication of the ‘discussion paper’ means that research is rapidly disseminated. Added to which, the interactive peer review and discussion means that authors receive feedback directly and can participate in the discussion. The final published research undergoes a full peer-review process, in addition to comments from other scientists, assuring the quality of the research, that is published in EGU journals.

On average, it takes approximately 200 days for a manuscript to complete its journey from submission to publication. However, this time can vary from journal to journal and manuscript to manuscript. This video, produced by our publisher Copernicus, shows the review times for various EGU Journals. Not only that, the average length of time the manuscript spends at each of the stages from submission to publication is broken down, too.

Maybe next time you come to publish your research findings you’ll consider submitting your manuscript to one of the EGU journals. You can learn more about the EGU publications by following this link. To submit your manuscript, head over to the website of any of the EGU journals, and look for the author guidelines and resources for reviewers.

Some food for thought to finish off this post: Have you ever considered the global journey a manuscript goes on after it is submitted? Using an article from Atmospheric Chemistry and Physics, Copernicus produced a video tracking its globetrotting journey: from its birth in Norway and collaborations in eight different countries, to its editor in Switzerland and referees spanning Europe and Asia, the global impact of this manuscript is truly remarkable.

Did you know you can follow many of the EGU journals on Twitter, too? With links to useful journal information, highlight and discussion papers, the social media platform provides a quick way to keep up to speed with the journals. Please follow this link to find out which journals are on Twitter.

Do you have any questions about EGU journals that were not answered in this post? Get in touch through the comments below.

References

Pöschl, U.: Multi-stage open peer review: scientific evaluation integrating the strengths of traditional peer review with the virtues of transparency and self-regulation, Frontiers in Computational Neuroscience, 6, 33, 1-16, doi:10.3389/fncom.2012.00033, 2012.

Introducing the new EGU logo!

$
0
0

New logo

As part of a long-term effort to modernise EGU’s overall look, today we are introducing a new EGU logo. You will find the new logo on all EGU websites (including General Assembly and journal websites) and social media pages, as well as in Vienna in April, at the EGU 2016 General Assembly.

The new logo retains elements of the previous one, including the circle with a tilted axis representing the Earth’s rotation axis, but the letters ‘EGU’ are larger and more easily discernible than in the old logo. When used in its simplest version (without the claim ‘European Geosciences Union’ shown above), the logo works in both large and small sizes, and is easy to view even on small-screen devices such as tablets and smartphones. We’ve also changed the EGU font. We previously used Verdana on our main website and the General Assembly page, but are now changing to Open Sans.

These changes are part of a long-term effort to make EGU’s visual identity more modern and more suitable for the increasing number of people who interact with the EGU and its products not only on paper and desktops, but also on laptops, tablets and smartphones.The next step will be to redesign the EGU website: we aim to make the page easier to navigate and suitable for desktop and mobile interfaces within the next few months to a year.

The EGU colours (blue and yellow) remain the same in the new visual identity. To find out more about EGU’s new look and view the various versions of the new logo, please check https://www.egu.eu/visual-identity/.

We thank André Roquette for creating the new EGU logo and visual identity.

This post is a shorter version of a full news announcement which you can read, in full, on our website.


The Sustainable Geoscientist – how many papers should academics really be publishing?

$
0
0

In this guest blog post, Nick Arndt, Professor at the Institut des Sciences de la Terre, Grenoble University, reflects on the pressures on academics to publish more and more papers, and whether the current scientific output is sustainable.

Imagine a highly productive car factory. Thousands of vehicles are built and each is tested as it leaves the factory; then it is stored in an enormous parking lot, never to be driven. Science publication is going this way. It is becoming an industry that produces without reason or limit, with no consideration whatsoever of whether the product is ever consumed.

A successful scientist is now required to publish 5 or more papers per year, the pressure coming from the need to foster the H-index and boost the total number of citations. Twenty years ago, to publish a paper in Nature or Science was all very well, but nothing that special; now, according to persistent rumours, a Chinese researcher can buy a used car with his share of the reward his university receives for such a publication.

Some months ago, a geoscientist (let’s call her Tracy) saw that Earth and Planetary Science Letters (EPSL) had published over twice as many papers in 2014 (about 630) than in 1990 (about 250). She recalled that twenty years ago there was just Nature; since then the publishing house has spawned Nature Geoscience, Nature Climate Change, Nature Arabic Edition and 36 other siblings, not to mention Nature Milestones, Networks, Gateways and Databases. In 2001 Copernicus Publications launched its first highly successful open-access journal; now it publishes about 50. Each day Tracy receives an email invitation to contribute to, or edit, a newly launched publication; such as the Comprehensive Research Journal of Semi-Qualitative Geodesy, impact factor 0.313, which “provides a extraordinary podium where scientists can share their research with the global community after having traversed numerous quality checks and legitimacy criteria, none of which promises to be liberal”. An editor of one well-known biology journal now handles 4300 manuscripts per year.

The explosion in the number of new journals means there are quite enough portals for Tracy to publish her annual quota, but are these papers ever consumed? What proportion is ever read? One well-known geoscientist published 114 papers in 2014, more than two per week. Did he have time to read them?

Imagine an artisan in a Morgan car factory, carefully hand-crafting V6 Roadsters, each car taking two full weeks to finish. Some of these become collection pieces, stored and never driven. Geoscience papers are going in the same direction – the time taken to write them is far, far longer than the time dedicated to reading them.

Many of us now admit that the only time we read a paper from cover to cover is when we do a review (the equivalent of the test drive). Tracy knows from talking to others that her own papers are never read thoroughly, even those that are remarkably highly cited.

Citation report for two highly productive researchers prepared by N. Arndt using Web of Science.

Citation report for two highly productive researchers (Prepared by N. Arndt using Web of Science).

Tracy has resolved to become sustainable, which means that she will publish no more than 2 papers per year and will train no more than two PhDs during her career. By avoiding shingling and taking care with the writing, the two papers will be quite sufficient to report the results of her research (at least those that warrant publication). The fate of some of her PhD students worries her; does a thorough knowledge of Semi-Qualitative Geodesy really help Judith, who now works in a bank, or Christophe, a mountain guide? She thought that 2 PhDs would be quite sufficient, one to replace her when she retired and the other reserved for that one student who was brilliant.

The sustainable geoscientist has a very mixed opinion of the science funding industry. She applauds the measures taken to help assure that money goes to the best science, but deplores the time and effort that is consumed. She spends a third of her time writing proposals to one agency or another, knowing that the chances of success are far less than one in ten. Another large slice of time is spent reviewing the proposals of others, a exercise she suspects is futile because the final decision will be based mainly on the H-index. She looks forward to the time when her grant proposals will be judged from the content of her two publications per year, which will be read thoroughly by all members of the evaluation committee.


By Nick Arndt, Professor at the Institut des Sciences de la Terre, Grenoble University & EGU Outreach Committee Chair


Editor’s note: This is a guest blog post that expresses the opinion of its author, whose views may differ from those of the European Geosciences Union. We hope the post can serve to generate discussion and a civilised debate amongst our readers.

GeoSciences Column: Improving together – science writing and football

$
0
0

Writing is something that those pursuing a career in academia are expected to be good at. It is a requirement of the job, yet it is a skill few get any formal training in and simply rely on the old saying that practice makes perfect. But what if there is another way? Mathew Stiller-Reeve is a co-founder of ClimateSnack, a writing group organization, which aims to tackle the problem. In today’s post Mathew considers how the workings of a football team might reflect the successes of the writing groups that started in the ClimateSnack project.

The premise behind the ClimateSnack project is simple: We need to improve our writing in science. But many young researchers do not have access to good training initiatives, especially not continuous ones. So, maybe we should just mobilize ourselves; we can mobilize ourselves by starting writing groups and working together to improve. In ClimateSnack, early career scientists (ECS) start writing groups at their home institute. Participants write short popular science articles (usually 400-500 words), read them aloud, get feedback, and publish online. Several ClimateSnack writing groups sprouted up all over the world, however, only a few truly blossomed. What made some groups work and some not? We analyzed the answer to this question in our new paper. The style of a peer-review paper didn’t allow us to make fancy, lengthy analogies. But on GeoLog, I feel safe using football as an analogy to explain the workings of a writing group, and maybe infuse some of my own personal opinions too.

Football is a team sport, but you can play football completely alone and still become an expert. You can see this when you watch football freestylers (like Indi Cowie in the video) do their incredible tricks. Most of these tricksters likely play football with a whole team, but they don’t have to. The same applies to science writing and communication. You can become an expert in these skills by yourself, and some people prefer this. But for ECS’s who like to work together, ClimateSnack would give them the opportunity to improve as part of a team: a writing group.

But what was needed for the teams to work successfully? And what did we learn from the teams that disbanded after a few training sessions?

Successful football teams have good leadership, and in particular good captains. Good captains bring out the best in their players, encourage them when things get hard and manage conflict. These elements were reflected in the ClimateSnack writing groups. The strong leaders guided the groups and encouraged participants to contribute in sensitive ways. However, strong leaders don’t stick around forever. Just as other football clubs often buy captains, writing group leaders also moved on; they finished PhDs and got jobs far, far away. New captains needed to be found, but this was always a challenge.

Can the workings of a football team reflect the successes of the writing groups that started in the ClimateSnack project? Credit: Syaza , distributed via gify.

Can the workings of a football team reflect the successes of the writing groups that started in the ClimateSnack project? Credit: Syaza , distributed via gify.

I am absolutely not saying that the leaders of the disbanded other groups were poor captains! Even a potentially good captain cannot lead a team if he/she doesn’t know the rules of the game. If the rules are not clear then the whole team cannot play properly together. They need to know where the goal is; they need to understand the game’s objectives. And this is where the ClimateSnack management team (where I am most to blame!) was shortsighted. We failed to properly communicate the objectives and aims of a ClimateSnack writing group and the writing process we suggested.

Even if a football team knows the rules and has a good captain, they won’t get far if morale is low, or if the players haven’t got time to train or turn up for matches. We noticed that a lot of the motivation within writing groups was linked to socializing. Just as some amateur football teams might go to the pub after training, one successful writing group planned their meetings just before the Department coffee break so everyone could socialize after the hard work was done.

What other elements need to be in place for a football team to work?

The right number of players is an absolute necessity. Most people have seen how a football team struggles after a couple of players have been sent off. You may have also heard about players going to other clubs if they don’t get to play enough matches. The ClimateSnack group meetings also faced challenges with the number of participants. One group had so many participants to start with that it became difficult to manage. It is difficult for everyone to get something out of a peer feedback discussion if too many are involved.  In this instance, participants lost interest and numbers decreased steadily and finally to a level where too few attended and the group disbanded. In our Bergen group, we always find that the best discussions happen with 4-6 people at the meetings. If we get far more than this in the future, then we will likely split into smaller discussion groups which work more effectively.

Effective writing groups demand some kind of time commitment from the participants. Good writing requires practice, just like football. Football players often train several times a week. With ClimateSnack, we did not have the luxury of asking the members for this level of commitment. Students are already under pressure from a variety of different sources. They need to complete mandatory courses, collect data, attend conferences, and work as teaching assistants. People who play football have a passion for the game and make time for it. Unfortunately, few young researchers have a passion for writing (cards on the table: I was exactly the same. It took a lot of time before I started enjoying writing). Therefore, something voluntary like a writing group will often fall by the wayside when to-do lists are being compiled.

A football team celebrates together after scoring a goal!

A football team celebrates together after scoring a goal! ( Lewes Ladies 2 BHA 1 4 May 2014. 645 , credit: James Boyes distributed via a href=” https://www.flickr.com/”> flickr).

Some ClimateSnack teams started scoring goals! ClimateSnack participants have published over 100 articles online, some of which articles have appeared in newspapers here in Norway. Many participants feel that their writing has improved. Some participants have even started receiving better peer reviews for their scientific publications. Other participants have also used their new network to organize science communication workshops. Even if many writing groups didn’t find a footing, for some people the concept worked really well. And many people have made good friends!

Just like with many football teams, they are more likely to score more goals if they have generous sponsors. Football clubs need to buy kits, pay for pitch maintenance and travel to play other teams. A writing group project like ClimateSnack ideally needs some funding to let new ideas flourish and allow different groups to interact and learn from each other. The ClimateSnack founders had big ambitions to create an international online community where ECS would interact and peer-review each other’s articles across borders. We secured some funding to update the website, but never to implement the kind of things needed to properly promote an international community.

Despite the challanges we encountered, we have seen that writing groups can be a really effective way to learn writing skills together (like ours in Bergen in the photo). Maybe they are so effective that universities should consider implementing them in curricula for all students at all levels. With this in mind, I’ll indulge with a final football-related analogy. When I was a child, we had to play football at school. I didn’t like it! However, now I appreciate that I got fit and healthier, and I learned skills that I could apply to other sports in the process. You see the link to learning basic writing skills?

Indeed, if you think about it, I could have applied the football team analogy to any aspect of research education: We can learn anything alone, but it can be more enjoyable and rewarding if we learn together. However, I think the analogy works well with communication. After all, this is the part of the research process where we really have to put ourselves out there, we have to receive feedback, debate our results, and defend our conclusions, often in open forums. These are all elements at the forefront of writing group dynamics.

Read more about the highs and lows of our ClimateSnack project in our paper in the recent HESS/NHESS special issue on Effective Science Communication and Education in Hydrology and Natural Hazards.

By Mathew Stiller-Reeve, co-founder of ClimateSnack and researcher at Bjerknes Centre for Climate Research, Bergen, Norway

Reference

Stiller-Reeve, M. A., Heuzé, C., Ball, W. T., White, R. H., Messori, G., van der Wiel, K., Medhaug, I., Eckes, A. H., O’Callaghan, A., Newland, M. J., Williams, S. R., Kasoar, M., Wittmeier, H. E., and Kumer, V.: Improving together: better science writing through peer learning, Hydrol. Earth Syst. Sci., 20, 2965-2973, doi:10.5194/hess-20-2965-2016, 2016.


Geosciences Column: A new rock outcrop map and area estimation for the entire Antarctic continent

$
0
0

Antarctica has been known as “the frozen continent” for almost as long as we have known of its existence. It may be the only place on Earth where, instead of information on the extent of glaciers or ice caps, there exists a dataset of all non-icy areas compiled from satellite imagery.

However, this repository is far from perfect: while satellite resolution and coverage have been steadily improving, Antarctica is challenging ground for remote sensing. Ice and cloud cover can be difficult to tell apart, and the low position of the sun in the sky means that long shadows can make snow, ice and rock very difficult to distinguish. As a result, the estimates of the ice-free proportion of the Antarctic continent have been vague, ranging from “less than 1%” to 0.4%.

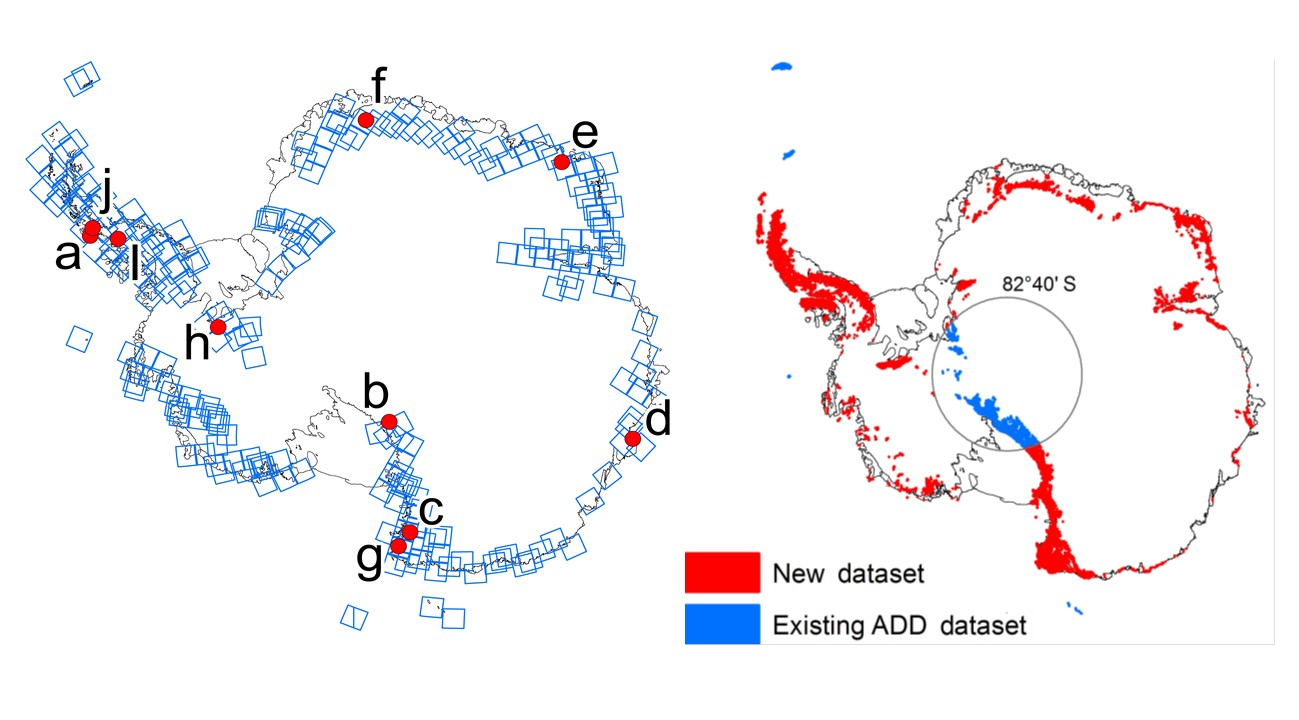
In a new paper published in the journal The Cryosphere, scientists from British Antarctic Survey and the University of Birmingham show that the continent is even icier than previously thought. Using imagery from NASA’s Landsat 8 satellite, they find that just 0.18% of the continent are ice-free – less than half of previous estimates. This equates to an area roughly the size of Wales on a continent half again as big as Canada.

Lead author Alex Burton-Johnson and his colleagues have developed a new method of accurately distinguishing between ice, rock, clouds and liquid water on Antarctic satellite imagery. Because of the challenging nature of classifying Antarctic satellite imagery, the researchers used only the highest-quality images: they were mostly taken in midsummer, when the sun describes the highest arc in the sky and shadows are smallest, and on days with low cloud cover.

jonf_main

(Left) The blue squares represent the coverage of the 249 satellite images the researchers used, showing that most rocky areas in Antarctica are clustered along the coastline. The images overlap in many places, allowing for more accurate classification where some clouds occur in pictures. (Right) The new dataset for rock outcrops covers all areas marked in red. The NASA Landsat 8 satellite does not cover areas south of 82°40′ South. Islands such as South Georgia and the South Orkney Islands are too consistently cloudy during the summer period, so the new method cannot be applied here. From : Burton-Johnson et al. (2016).

The huge thickness of the Antarctic ice sheet – more than 4,000m in some places – made the scientists’ job easier: they could exclude large parts of the continent where not even the tallest peaks come close to the ice surface. A total of 249 suitably high-quality images covered those parts of the Antarctic continent that have rock outcrops.

A few locations, however, are too extreme for the new image classification method. Some of the South Orkney Islands and the subantarctic island of South Georgia are covered in heavy cloud for so much of the time even in summer that the researchers could not apply their new method. Here, they had to rely on the older dataset. They also had to exclude parts of the rugged but remote Transantarctic Mountains from the study as the Landsat 8 satellite only covers areas north of 82°40’S.

The code for the new classification methodology is available on GitHub, so that enthusiastic remote sensers can try their hand at further improving it or simply admire the frozen beauty of Antarctica from above.

By Jonathan Fuhrmann

References

Burton-Johnson, A., Black, M., Fretwell, P. T., and Kaluza-Gilbert, J.: An automated methodology for differentiating rock from snow, clouds and sea in Antarctica from Landsat 8 imagery: a new rock outcrop map and area estimation for the entire Antarctic continent, The Cryosphere, 10, 1665-1677, doi:10.5194/tc-10-1665-2016, 2016.

Enmeshed in the gears of publishing – lessons from working as a young editor

$
0
0

Editors of scientific journals play an important role in the process research publication. They act as the midpoint between authors and reviewers, and set the direction of a given journal. However, for an early career scientist like me (I only defended my PhD in early December 2016) the intricacies of editorial work remained somewhat mysterious. Many academic journals tend to appoint established, more senior scientists to these roles, and while most scientists interact with editors regularly their role is not commonly taught to more junior researchers. I was fortunate to get the chance to work, short term, as an associate editor at Nature Geoscience in the first 4 months of this year (2017). During that time, I learned a number of lessons about scientific publishing that I felt could be valuable to the community at large.

What does an editor actually do?

The role of the editor is often hidden to readers; in both paywalled and open-access journals the notes and thoughts editors make on submitted manuscripts are generally kept private. One of the first things to appreciate is that editors judge whether a manuscript meets a set of editorial thresholds that would make it appropriate for the journal in question, rather than whether the study is correctly designed or the results are robust. I’d argue most editors are looking for a balance of an advance beyond existing literature and the level of interest a manuscript offers for their audience.

At each step of the publication process, from initial submission, through judging referee comments, to making a final decision, the editor is making a judgement whether the manuscript still meets those editorial thresholds.

The vast majority of the papers I got the chance to read were pretty fascinating, but since the journal I was working for is targeted at the whole Earth science community some of these were a bit too esoteric, and as such didn’t fit the thresholds we set to appeal to the journal audience.

I actually found judging papers on the basis of editorial thresholds refreshing – in our capacity as peer reviewers, most scientists are naturally sceptical of methodology and conclusions in other studies, but as an editor in most cases I was able to take the authors conclusions at face-value, and leave the critical assessment to referees.

That’s where the important difference lies; even though editors are generally scientists by training, since they are naturally not experts in every field that they receive papers from, it’s paramount to find reviewers who have the appropriate expertise and to ask them the right set of questions. In journals with academic editors, the editors may have more leeway to make critical comments, but impartiality is key.

Much of this may be already clear to many readers, but perhaps less so to more junior scientists. Many of the editorial decisions are somewhat subjective, like gauging the level of interest to a journal audience.

In the context of open access research journals, I think it’s worth asking whether the editorial decisions should also be made openly readable by authors and referees – this might aid potential authors in deciding how to pitch their articles to a given journal. This feeds into my next point – what are journals looking for?

By which metrics do journals judge studies?
The second big thing I picked up is that the amount of work does not always equate to a paper being appropriate for a given journal. Invariably, authors have clearly worked hard, and it’s often really tricky to explain to authors that their study is not a good fit for the journal you’re working for.

Speaking somewhat cynically, journals run for profit are interested in articles that can sell more copies or subscriptions. Since the audiences are primarily scientists, “scientific significance” will be a dominant consideration, but Nature and subsidiary journals also directly compare the mainstream media coverage of some of their articles with that of Science – that competition is important to their business.

Many other authors have discussed the relative merits of “prestige” journals (including Nobel prize winners – https://www.theguardian.com/science/2013/dec/09/nobel-winner-boycott-science-journals), and all I’ll add here is what strikes me most is that ‘number of grad student hours worked’ is often not related to those articles that would be of a broader interest to the more mainstream media. The majority of articles don’t attract media attention of course, but I’d also argue that “scientific significance” is not strongly linked to the amount of time that goes into each study.

In the long run, high quality science tends to ensure a strong readership of any journal, but in my experience as an editor the quality of science in submitted manuscripts tends to be universally strong – the scientific method is followed, conclusions are robust, but in some cases they’re just pitched at the wrong audience. I’d argue this is why some studies have found in meta-analysis that in the majority of cases, articles that are initially rejected are later accepted in journals of similar ‘prestige’ (Weller et al. 2001, Moore et al. 2017).

As such, it’s imperative that authors tailor their manuscripts to the appropriate audience. Editors from every journal are picking from the same pool of peer reviewers, and so the quality of reviews should also be consistent, which ultimately determines the robustness of a study; so to meet editorial thresholds, prospective authors should think about who is reading the journal.
It’s certainly a fine line to walk – studies that are confirmatory of prior work tend to attract fewer readers, and as such editors may be less inclined to take an interest, but these are nonetheless important for the scientific canon.

In my short time as an editor I certainly didn’t see a way around these problems, but it was eye-opening to see the gears of the publication system – the machine from within, as it were.

Who gets to review?
One of the most time-consuming jobs of an editor is finding referees for manuscripts. It generally takes as long, if not far longer, than reading the manuscript in detail!

The ideal set of referees should first have the required set of expertise to properly assess the paper in question, and then beyond that be representative of the field at large. Moreover, they need to have no conflict of interest with the authors of the paper. There are an awful lot of scientists working in the world at the moment, but in some sub-fields it can be pretty hard to find individuals who fit all these categories.

For example, some studies in smaller research fields with a large number of senior co-authors often unintentionally rule out vast swathes of their colleagues as referees, simply because they have collaborated extensively.

Ironically, working with everyone in your field leaves no-one left to review your work! I have no doubt that the vast majority of scientists would be able to referee a colleagues work impartially, but striving for truly impartial review should be an aim of an editor.

As mentioned above, finding referees who represent the field is also important. More senior scientists have a greater range of experience, but tend to have less time available to review, while junior researchers can often provide more in-depth reviews of specific aspects. Referees from a range of geographic locations help provide diversity of opinion, as well as a fair balance in terms of gender.

It was certainly informative to compare the diversity of authors with the diversity of the referees they recommended, who in general tend to be more male dominated and more US-centric than the authors themselves.

A positive way of looking at this might be that this represents a diversifying Earth science community; recommended referees tend to be more established scientists, so greater author diversity might represent a changing demographic. On the other hand, it’s certainly worth bearing in mind that since reviewing is increasingly becoming a metric by which scientists themselves are judged, recommending referees who are more diverse is a way of encouraging a more varied and open community.

What’s the job like?
Editorial work is definitely rewarding – I certainly felt part of the scientific process, and providing a service to authors and the readership community is the main remit of the job.

I got to read a lot of interesting science from a range of different places, and worked with some highly motivated people. It’s a steep learning curve, and tends to be consistently busy; papers are always coming in, so there’s always a need to keep working.

Perhaps I’m biased, but I’d also suggest that scientists could work as editors at almost any stage in their careers, and it offers a neat place between the world of academia and science communication, which I found fascinating.

By Robert Emberson, freelance science writer

References

Moore, S., Neylon, C., Eve, M. P., O’Donnell, D. P., and Pattinson, D. 2017. “Excellence R Us”: university research and the fetishisation of excellence. Palgrave Communications, 3, 16105

Weller A.C. 2001 Editorial Peer Review: Its Strengths and Weaknesses. Information Today: Medford NJ

GeoSciences Column: When could humans last walk, on land, between Asia & America?

$
0
0

Though now submerged under 53 m of ocean waters, there once was a land bridge which connected North America with Asia, allowing the passage of species, including early humans, between the two continents. A new study, published in the EGU’s open access journal Climate of the Past, explores when the land bridge was last inundated, cutting off the link between the two landmasses.

The Bering Strait, a narrow passage of water, connects the Arctic Ocean with the Pacific Ocean. Located slightly south of the Arctic Circle, the shallow, navigable, 85 km wide waterway is all that separates the U.S.A and Russia. There is strong evidence to suggest that, not so long ago, it was possible to walk between the two*.

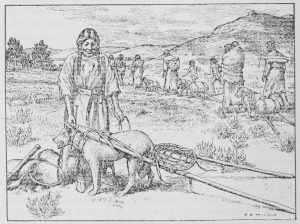
The Paleolithic people of the Americas. Evidence suggests big-animal hunters crossed the Bering Strait from Eurasia into North America over a land and ice bridge (Beringia). Image: The American Indian by Clark Wissler (1917). Distributed via Wikipedia.

In fact, though the subject of a heated, ongoing debate, this route is thought to be one of the ones taken by some of the very first human colonisers of the Americas, some 16, 500 years ago.

Finding out exactly when the Bering Strait last flooded is important, not only because it ends the last period when animals and humans could cross between North America and northeast Asia, but because an open strait affects the two oceans it connects. It plays a role in how waters move around in the Arctic Ocean, as well as how masses of water with different properties (oxygen and/or salt concentrations and temperatures, for example) arrange themselves. The implications are significant: currently, the heat transported to Arctic waters (from the Pacific) via the Bering Strait determines the extend of Arctic sea ice.

As a result, a closed strait has global climatic implications, which adds to the importance of knowing when the strait last flooded.

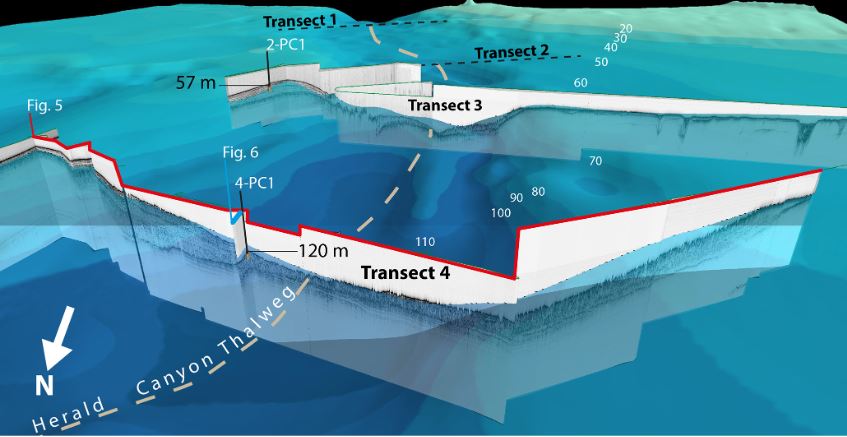
The new study uses geophysical data which allowed the team of authors to create a 3D image of the Herald Canyon (within the Bering Strait). They combined this map with data acquired from cylindrical sections of sediment drilled from the ocean floor to build a picture of how the environments in the region of the Bering Strait changed towards the end of the last glaciation (at the start of a time known as the Holocene, approximately 11,700 years ago, when the last ‘ice age’ ended).

At depths between 412 and 400 cm in the cores, the sediment experiences changes in physical and chemical properties which, the researchers argue, represent the time when Pacific water began to enter the Arctic Ocean via the Bearing strait. Radiocarbon dating puts the age of this transition at approximately 11, 000 years ago.

Above this transition in the core, the scientist identified high concentrations of biogenic silica (which comes from the skeletons of marine creatures such as diatoms – a type of algae – and sponges); a characteristic signature of Pacific waters. Elevated concentrations of a carbon isotope called delta carbon thirteen (δ 13Corg), are further evidence that marine waters were present at that time, as they indicate larger contributions from phytoplankton.

The sediments below the transition consist of sandy clayey silts, which the team interpret as deposited near to the shore with the input of terrestrial materials. Above the transition, the sediments become olive-grey in colour and are exclusively made up of silt. Combined with the evidence from the chemical data, the team argue, these sediments were deposited in an exclusively marine environment, likely influenced by Pacific waters.

Combining geophysical data with information gathered from sediment cores allowed the researchers to establish when the Bering Strait closed. This image is a 3-D view of the bathymetry of Herald Canyon and the chirp sonar profiles acquired along crossing transects. Locations of the coring sites are shown by black bars. Figure taken from M. Jakobsson et al. 2017.

The timing of the sudden flooding of the Bering Strait and the submergence of the land bridge which connected North America with northeast Asia, coincides with a period of time characterised by Meltwater pulse 1B, when sea levels were rising rapidly as a result of meltwater input to the oceans from the collapse of continental ice sheets at the end of the last glaciation.

The reestablishment of the Pacific-Arctic water connection, say the researchers, would have had a big impact on the circulation of water in the Arctic Ocean, sea ice, ecology and potentially the Earth’s climate during the early Holocene. Know that we are more certain about when the Bering Strait reflooded, scientist can work towards quantifying these impacts in more detail.

By Laura Roberts Artal, EGU Communications Officer


*Authors’s note: In fact, during the winter months, when sea ice covers the strait, it is still possible to cross from Russia to the U.S.A (and vice versa) on foot. Eight people have accomplished the feat throughout the 20th Century. Links to some recent attempts can be found at the end of this post.

References and resources:

Jakobsson, M., Pearce, C., Cronin, T. M., Backman, J., Anderson, L. G., Barrientos, N., Björk, G., Coxall, H., de Boer, A., Mayer, L. A., Mörth, C.-M., Nilsson, J., Rattray, J. E., Stranne, C., Semiletov, I., and O’Regan, M.: Post-glacial flooding of the Bering Land Bridge dated to 11 cal ka BP based on new geophysical and sediment records, Clim. Past, 13, 991-1005, https://doi.org/10.5194/cp-13-991-2017, 2017.

Barton, C. M., Clark, G. A., Yesner, D. R., and Pearson, G. A.: The Settlement of the American Continents: A Multidisciplinay Approach to Human Biogeography, The University of Arizona Press, Tuscon, 2004.

Goebel, T., Waters, M. R., and Rourke, D. H.: The Late Pleistocene Dispersal of Modern Humans in the Americas, Science, 319,1497–1502, https://doi.org/10.1126/science.1153569, 2008

Epic explorer crossed frozen sea (BBC): http://news.bbc.co.uk/2/hi/uk_news/england/humber/4872348.stm

Korean team crossed Bering Strait (The Korean Herald): http://www.koreaherald.com/view.php?ud=20120301000341

Geosciences Column: The science behind snow farming

$
0
0

For roughly the last decade, some ski resorts and other winter sport facilities have been using a pretty unusual method to ensure white slopes in winter. It’s called snow farming. The practice involves collecting natural or artificially made snow towards the end of winter, then storing the frozen mass in bulk over the summer under a thick layer of sawdust, woodchips, mulch, or other insulating material.

Many winter sport destinations have adopted the practice. In preparation for the 2014 Winter Olympics, Sochi, Russia stockpiled about 800,000 cubic metres of human-made snow during the warmer season, enough snow to fill 320 Olympic-size swimming pools.

Despite the growing trend, there still is little research on snow farming techniques. Recently, a team of scientists from the Institute for Snow and Avalanche Research (SLF) and the CRYOS Laboratory at the École Polytechnique Fédérale in Switzerland examined the success of snow conservation practices and used models to estimate what factors influence covered snow. Their findings were published in the EGU’s open access journal The Cryosphere.

Why store snow for the winter?

The ski industry has been storing snow for many reasons. The practice is a way for winter sports facilities to accommodate training athletes, start ski seasons earlier, and guarantee snow for major sports events. Snow farming can also be seen as a way to adapt to Earth’s changing climate, according to the authors of the study. Indeed, research published last year in The Cryosphere, found that the Alps may lose as much as 70 percent of snow cover by the end of the century if global warming continues unchecked. Snow loss to this degree could severely threaten the $70 billion dollar (57 billion EUR) industry and the alpine communities that depend on ski tourism.

For some ski resorts, the effects of climate change are already visible. For example, in Davos, Switzerland, a popular venue of the International Ski Federation Cross-Country World Cup, winter temperatures have risen over the last century while snow depth in turn has steadily declined.

Snow heap study

The research team studied two snow heaps: one near Davos, Switzerland (pictured here) and another in South Tyrol. Credit: Grünewald et al.

To better understand snow conservation techniques, the research team studied two artificially made snow heaps: one sitting near Davos and another located in South Tyrol. Each pile contained approximately 7,000 cubic metres of snow, about enough ice and powder to build 13,000 1.8-metre tall snowmen. The piles were also each covered with a 40 cm thick layer of sawdust and chipped wood.

Throughout the 2015 spring and summer season, the researchers measured changes in snow volume and density, as well as recorded the two sites’ meteorological data, including air temperature, humidity, wind speed and wind direction. The research team also fed this data to SNOWPACK, a model that simulates snow pile evolution and helps determine what environmental processes likely impacted the snow.

Cool under heat

From their observations, the researchers found that the sawdust and chipped wood layering conserved more than 75 percent of the Davos snow volume and about two thirds of the snow in South Tyrol. Given the high proportion of remaining snow, the researchers conclude that snow farming appears to be an effective tool for preparing for winter.

According to the SNOWPACK model, while sunlight was the biggest source of snow melt, most of this solar radiation was absorbed by the layer of sawdust and wood chips. The simulations suggest that the snow’s covering layer took in the sun’s heat during the day, then released this energy at night, creating a cooling effect on the snow underneath. Even more, the model found that, when the thick layer was moist, the evaporating water cooled the snow as well. The researchers estimate that only nine percent of the sun’s energy melted the snow heaps. Without the insulating layer, the snow would have melted far more rapidly, receiving 12 times as much energy from the sun if uncovered, according to the study.

Images of the South Tyrol snow heap from (a) 19 May and (b) 28 October. The snow depth (HS) is featured in c & d and snow height change (dHS) is shown in e. Credit: Grünewald et al.

The researchers found that the thickness of the covering layer was an important factor for snow conservation. When the team modelled potential snow melt under a 20 cm thick cover, the insulating and cooling effects from the layer had greatly diminished.

The simulations also revealed that, while higher air temperatures and wind speed increased snow melt, this effect was not very significant, suggesting that subalpine areas could also benefit from snow farming practices.

In the face of changing climates and disappearing snow, snow farming may be one solution for keeping winters white and skiers happy.

References

Grünewald, T., Wolfsperger, F., and Lehning, M.: Snow farming: conserving snow over the summer season, The Cryosphere, 12, 385-400, https://doi.org/10.5194/tc-12-385-2018, 2018.

Marty, C., Schlögl, S., Bavay, M., and Lehning, M.: How much can we save? Impact of different emission scenarios on future snow cover in the Alps, The Cryosphere, 11, 517-529, https://doi.org/10.5194/tc-11-517-2017, 2017.


Extreme snowfall potentially worsened Nepal’s 2015 earthquake-triggered avalanche

$
0
0

Three years ago, an earthquake-induced avalanche and rockfalls buried an entire Nepalese village in ice, stone, and snow. Researchers now think the region’s heavy snowfall from the preceding winter may have intensified the avalanche’s disastrous effect.

The Langtang village, just 70 kilometres from Nepal’s capital Kathmandu, is nestled within a valley under the shadow of the Himalayas. The town was popular amongst trekking tourists, as the surrounding mountains offer breathtaking hiking opportunities.

But in April 2015, a 7.8-magnitude earthquake, also known as the Gorkha earthquake, triggered a massive avalanche and landslides, engulfing the village in debris.

Scientists estimate that the force of the avalanche was half as powerful the Hiroshima atomic bomb. The blast of air generated from the avalanche rushed through the site at more than 300 kilometres per hour, blowing down buildings and uprooting forests.

By the time the debris and wind had settled, only one village structure was left standing. The disaster claimed the lives of 350 people, with more than 100 bodies never located.

Before-and-after photographs of Nepal’s Langtang Valley showing the near-complete destruction of Langtang village. Photos from 2012 (pre-quake) and 2015 (post-quake) by David Breashears/GlacierWorks. Distributed via NASA Goddard on Flickr.

Since then, scientists have been trying to reconstruct the disaster’s timeline and determine what factors contributed to the village's tragic demise.

Recently, researchers discovered that the region’s unusually heavy winter snowfall could have amplified the avalanche’s devastation. The research team, made up of scientists from Japan, Nepal, the Netherlands, Canada and the US, published their findings last year in the EGU’s open access journal Natural Hazards and Earth System Sciences.

To reach their conclusions, the team drew from various observational sources. For example, the researchers created three-dimensional models and orthomosaic maps, showing the region both before it was hit by the coseismic events and afterwards. The models and maps were pieced together using data collected before the earthquake and aerial images of the affected area taken by helicopter and drones in the months following the avalanche.

They also interviewed 20 villagers local to the Langtang valley, questioning each person on where he or she was during the earthquake and how much time had passed between the earthquake and the first avalanche event. In addition, the researchers asked the village residents to describe the ice, snow and rock that blanketed Langtang, including details on the colour, wetness, and surface condition of the debris.  

Based on their own visual ice cliff observations by the Langtang river and the villager interviews, the scientists believe that the earthquake-triggered avalanche hit Langtang first, followed then by multiple rockfalls, which were possibly triggered by the earthquake’s aftershocks.

A three-dimensional view of the Langtang mountain and village surveyed in this study. Image: K. Fujita et al.

According to the researchers’ models, the primary avalanche event unleashed 6,810,000 cubic metres of ice and snow onto the village and the surrounding area, a frozen flood about two and a half times greater in volume than the Egyptian Great Pyramid of Giza. The following rockfalls then contributed 840,000 cubic metres of debris.  

The researchers discovered that the avalanche was made up mostly of snow, and furthermore realized that there was an unusually large amount of snow. They estimated that the average snow depth of the avalanche’s mountainous source was about 1.82 metres, which was similar to snow depth found on a neighboring glacier (1.28-1.52 metres).

A deeper analysis of the area’s long-term meteorological data revealed that the winter snowfall preceding the avalanche was an extreme event, likely only to occur once every 100 to 500 years. This uncommonly massive amount of snow accumulated from four major snowfall events in mid-October, mid-December, early January and early March.

From these lines of evidence, the team concluded that the region’s anomalous snowfall may have worsened the earthquake’s destructive impact on the village.

The researchers believe their results could help improve future avalanche dynamics models. According to the study, they also plan to provide the Langtang community with a avalanche hazard map based on their research findings.  

Further reading

Qiu, J. When mountains collapse… Geolog (2016).

Roberts Artal, L. Geosciences Column: An international effort to understand the hazard risk posed by Nepal’s 2015 Gorkha earthquake. Geolog (2016).

Viewing all 89 articles
Browse latest View live


Latest Images